Real-time data visualization graphing site to share renewable and conventional energy usage data across the Southwest used by seven utilities and the UA.

Dynamic Graphing
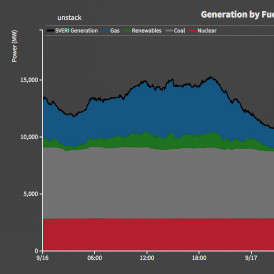
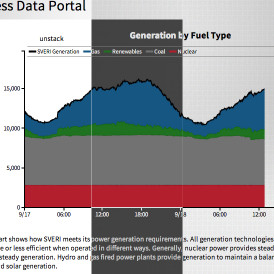
Dynamic data-driven graphs based on live data, using a D3 library depict engery details.
Search by Date
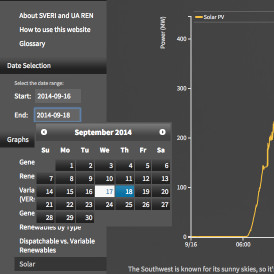
For ease of use, filter dates of selected data on the fly.
Download and Share
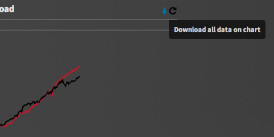
Download chart data as a CSV file to easily save and share in Excel.
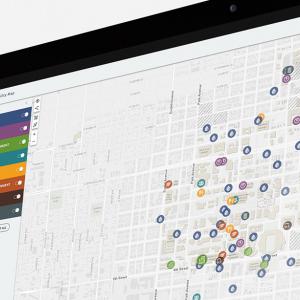
Live Mapping
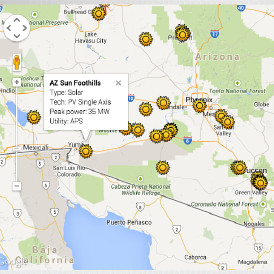
Map of different Renewable Energy sites are quickly identified with icons that are loaded with current data.
Flexible Viewing
3 style templates provide best legibility for viewing in different environments.
Responsive design: